
Uniswap Liquidity Provision: Is the Yield Worth the Risk?
Uniswap Liquidity Provision: Is the Yield Worth the Risk?
Introduction
Uniswap is the most popular AMM in DeFi. As of May 31st, 2022, Uniswap V3 had 4.01 billion USD of liquidity staked in its pools with a daily trading volume of 1.29 billion USD, while Uniswap V2 had 1.74 billion USD staked and a daily trading volume of 91 million USD. However, a question many liquidity providers (LPs) should be asking is whether depositing their tokens in Uniswap will outperform other strategies.
In the previous article I demonstrated how a better method of measuring the performance of an AMM pool is by checking the implied volatility relative to expected or historical volatility.
In this article, I will elaborate on the implications of Uniswap underpricing implied volatility and how it can be corrected.
Implied Volatility
In the previous article I described how an Uniswap V2 liquidity provision position is in fact a perpetual short straddle where the strike price is the current market price. Hence, when one provides liquidity to an Uniswap pool, they are selling volatility on the token pair of the pool.
For that reason, the determinant of whether an Uniswap liquidity provision position will be profitable is not the yield the Uniswap pool pays but rather the implied volatility.
If implied volatility (IV) has been greater than historical volatility (HV) then liquidity provisioning will have outperformed holding tokens outside of Uniswap. If IV has been less than historical volatility, then liquidity provision will have underperformed holding tokens outside of Uniswap.
To determine the implied volatility of Uniswap V2, I used the formula from a previous article regarding how to calculate implied volatility from Uniswap.
Deribit Implied Volatility
To benchmark the implied volatility calculations of Uniswap, we’ll use Deribit’s implied volatility index DVOL. Deribit is a centralized options exchange that works with an order book the same way as options exchanges in traditional financial markets work.
Deribit options are sold as traditional options that expire within a set period of time, have different strike prices and premiums are paid in full in advance. This is unlike the perpetual straddles sold in Uniswap. Deribit currently is the options exchange with the most volume in the cryptocurrency market and a place where most traditional finance professionals feel at home trading cryptocurrency options. One can therefore expect Deribit options to be better priced and have more accurate measures of implied volatility than markets in decentralized finance.
Deribit’s implied volatility is from at the money seven day options. At the money options are adequate because all straddles sold in Uniswap V2 are at the money straddles and seven day options because those are the options with the lowest theta (time risk) available in Deribit’s DVOL index and Uniswap’s straddle’s have a theta of 0 (no expiration risk). The DVOL index in the chart is smoothed with a 30 day moving average to remove noise. Historical volatility is based on 30 days of log returns.
Implied annual forward rate of the asset according to put-call parity.
The description of Deribit’s implied volatility index is beyond the scope of this article.
If the reader wishes to learn more about it there is extensive documentation of their methodology on their site.
Uniswap V2 USDC-ETH Pool Implied Volatility
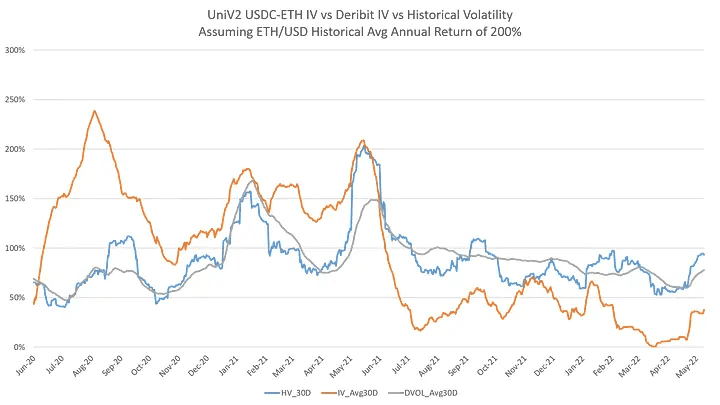
Now to get to the results let’s take a look at Uniswap V2 USDC-ETH pool, the largest pool in Uniswap V2, under the assumption that the average annual return of ETH/USD is 200% per year, which is about the historic average for Ethereum vs the US dollar.
As you can see above under the assumption that the average annual return of ETH/USD is 200%, implied volatility was significantly higher from June 2020 (Uniswap V2 launched in May 2020) to the first half of 2021 but then dropped substantially in the latter half of 2021 to today. The yield was worth the risk from June 2020 to the first half of 2021 but not after, assuming the annual return for this whole period of time is about 200%.
If it is no longer positive EV to hold tokens in Uniswap, or at the very least less profitable than alternatives, then why are LPs still providing liquidity?
New Market Expectations
Maybe Uniswaps liquidity providers have new expectations regarding the price appreciation of Ethereum vs the US dollar. It’s a common argument in the cryptocurrency industry that as the size of the Bitcoin network grows the rate of appreciation of Bitcoin relative to the US dollar will diminish. There are several reasons for this but they can all be encapsulated by the concept of risk.
As the size of the Bitcoin network grows, the riskiness of Bitcoin as an investment decreases. The same concept would apply to the Ethereum network. Since risk and volatility are correlated, as the size of the Ethereum network grows, the volatility will also decrease and this will be reflected in the market price IV for Ethereum.
Therefore, let’s assume that the average annual return of Ethereum is now half of what it used to be at 100%.
As you can see in the chart the implied volatility of the Uniswap V2 USDC-ETH pool now better tracks historical volatility and Deribit’s implied volatility after mid 2021. Therefore, if we assume that the market for volatility is fairly priced in Unsiwap, then the market truly expects a lower average annual return for Ethereum after mid 2021.
However, there is still a problem when trying to judge historical performance. Under this new assumption, the implied volatilities were significantly higher from mid 2020 to mid 2021. Therefore, yields were excessively profitable under the assumption of 100% annual returns during this time period. But we know that was not true.
The entire average annual return of Ethereum in the period, as stated earlier, was around 213%, and if we only focus in the period of the bull market (late 2020 to mid 2021), the annual return was significantly higher. Therefore, assuming a 100% average annual return for the whole period, the performance of the Uniswap V2 USDC-ETH pool in the first half of this time range is exaggerated.
In addition, there are still some short periods of substantial differences between the implied volatility of Uniswap and historical volatility after mid 2021.
Could these periods also be exaggerated? Could the average returns during these periods actually have been higher (or more negative) and therefore would’ve implied a lower volatility?
Adjusting IV for Observed Returns
We need a way to measure historical performance using a dynamic measure of the drift of the asset just like Deribit uses the historical implied forward rate from its market. Remember that the value of μ in the implied volatility model above comes from the Geometric Brownian Motion (GBM) assumption described in the article about expected impermanent loss.
Therefore we can estimate the value of μ by getting a historical estimate of the mean return, for example by doing a 30 day moving average of log returns and setting them equal to the average return in the Geometric Brownian Motion model.
Then solve for the drift μ
Then we can plug in this value of μ which is based on observed price data into the implied volatility model to see what was the implied volatility throughout time based on our estimate of market drift, μ, from observed price data.
As you can see although around the time of the release of Uniswap V2, IV was significantly higher, it dipped far below HV during the early months of 2021, despite Deribit IV keeping in track with HV. Meaning this was an issue only in Uniswap, not the entire market for cryptocurrency volatility. The same thing happened from August to September 2021, deviating once again from Deribit IV. It has since been closing and widening its gap with HV, going below it recently, despite Deribit IV remaining fairly constant and close to HV.
What is the effect on LP performance?
One can check that the dips above were indeed periods of underperformance by checking the historical performance of an LP that has been providing liquidity throughout the entire time period above.
Since we are trying to evaluate only the effect of liquidity provision we will use the impermanent loss including fees formula from the article regarding total returns and impermanent loss from liquidity provision
The statistics of the returns of the LP portfolio above are the following.
Given the large drawdown the liquidity provider (LP) experienced, the risk adjusted returns are relatively low. The fact that the LP is still profitable is not statistically significant from random luck.
A better view of how these dips in IV below HV affect an LP can be seen when checking the moving 30 day returns of liquidity provision.
As you can see there are frequent periods of negative performance, which although may result in a portfolio that yields a positive return in the long term, they unduly depresses the risk adjusted returns. Why unduly? because these dips in IV are not seen in Deribit, hence not a general market expectation.
What do these effects look like in terms of the total returns of an LP position? (An LP that is not shorting the reserve tokens and therefore is also long USDC and ETH, as most LPs are)
As you can see above, the Uniswap liquidity pool position is only positive today because ETH/USD is near the lows of the past year. The difference between the gray and blue line show the effect of the trading fees on impermanent loss. Regardless, for most of the time period, a LP closing his position in Uniswap would’ve incurred a loss versus holding the position outside of Uniswap.
Although, certainly there are periods where IV deviates substantially above HV, one must consider that Uniswap is a new product. Nothing like it has ever existed before. Trading volumes may increase substantially above available liquidity, thus yielding tremendously high fees. That is, Uniswap is in a period of high growth accelerated by the growth of cryptocurrencies as an industry, which provides a temporary boost to the returns from liquidity provision in Uniswap.
However, what will happen when the DeFi market matures? It is my belief that the charts above our forecasting what will happen. After mid 2021, the end of the bull market, positive deviations over HV are much smaller.
Is this an Isolated Issue?
Given that Uniswap V2 USDC-ETH pool is the most liquid pool not just in terms of liquidity provided, 158 million USD as of June 3rd, 2022, but also in terms trading volume, averaging 30.4 million USD per day on 2022 so far, one would expect the USDC-ETH pool would be the least likely place to have such issues.
However, given that this is an issue that plagues Uniswap V2’s most liquid pool one can expect similar inefficiencies in other pools. And that is indeed the case.
As you can see above the in the WBTC-USDC pool, IV often dipped below HV while Deribit IV maintained itself closer to HV. The effects of these deviations can also be seen in liquidity provision throughout this time
The result is the same with the WBTC-ETH pool. IV often dipped below HV.
The effects are also visible in the 30 day moving returns of a liquidity provision position.
One thing to note though is that there was a liquidity mining program to issue UNI (Uniswap governance token) tokens, that ran from September 2020 to November 2020, to liquidity providers in some Uniswap V2 pools. USDC-ETH and WBTC-ETH pools were part of it but not the WBTC-USDC pool. Perhaps that’s the reason why the USDC-ETH and WBTC-ETH pools were able to perform so well around that time period.
What about Uniswap V3?
While one can surely concentrate liquidity in Uniswap V3 to increase the yields its pools pay, one must not forget that concentrating liquidity is a leveraged position in Uniswap V3. The mathematics explaining why this is the case can be found in the Uniswap V3 white paper, which is beyond the scope of this article.
Essentially when you concentrate liquidity in Uniswap V3 you are not just magnifying the returns but also the risks. Therefore to make an appropriate comparison between Uniswap V3 and Uniswap V2 one must delever Uniswap V3’s liquidity provision by providing liquidity across the entire price range, the same as Uniswap V2 does. We can then compare the implied volatilities for both pools, the assumption of the price drift is irrelevant since they would be the same for both pools, the only difference is in the yields they pay.
As you can see above both pools’ implied volatilities have tracked each other most of the time with similar dips below HV unlike Deribit IV. However most significant is the large deviation in November. Maybe this is because of the popularity of Uniswap V3 relative to V2. IV remained oversold in V3 relative to V2 for about a month due to too many people providing liquidity in V3 compared to V2. The effects also show up in the moving 30 day returns of liquidity provision.
The returns for the USDC-ETH pair in Uniswap V3 were about half of what they were for Uniswap V2 in the month of November.
Why is this happening?
Uniswap and other AMMs only allow the ability to sell volatility they do not allow anyone to buy volatility from them. While newcomers to Defi might raise volumes sufficiently enough to make yields from trading fees worthwhile to provide liquidity, these high yields attract more liquidity providers to sell more volatility until it suppresses IV.
Unlike Deribit where a low price of volatility will attract buyers of volatility, Uniswap and other AMMs are a one sided volatility marketplace only enabling users to sell volatility. Therefore the volatility market in AMMs cannot function properly and adjust itself rapidly enough when volatility is cheap, unlike Deribit, without first causing losses to liquidity providers.
The volatility market in AMMs must first wait till liquidity providers experience losses from realized volatility in the underlying assets for them to remove their liquidity and therefore for IV to rise to sensible levels again.
This not only results in mispricings of volatility but even in discrepancies that should be arbitraged away if one could purchase volatility from an AMM.
For example, there are differences in implied volatility between Uniswap V2 and V3, as can be seen in one of the charts above, despite being essentially the same products.
A Solution
One way to solve this problem is for liquidity providers to be mindful of the implied volatility at which they are providing liquidity in Uniswap and other AMMs. However, that requires more active management in an investment product that is meant to be used passively. Otherwise, liquidity providers should sell volatility in Deribit, where their options would frequently expire and they would therefore need to constantly rebalance their portfolio.
A more robust solution is to enable the possibility to buy volatility from Uniswap. That would create incentives for market participants to prevent implied volatility from dropping below the levels seen in traditional option markets. Thus improving the performance of liquidity provision. However, this type of solution currently does not exist but will be the subject of the next article.
Why is this important?
Without a proper functioning market for volatility, liquidity providers are not compensated adequately for the risks they take. Without proper compensation they may experience excessive losses which would further diminish trust in liquidity provision through AMMs, and thus lower overall liquidity for decentralized trading.
While I focused on Ethereum and Bitcoin, which are as safe as one can think of an asset in the cryptocurrency market, there are many other untested projects that require liquidity provision to get off the ground but whose risks are not properly assessed by the market due to a lack of ability to buy risk.
Above is the result of liquidity provision in the Uniswap V3 LUNA/ETH pool. The losses from impermanent loss were almost complete to liquidity providers, despite the high yields from trading fees. These types of situations more often happen in rug pulls but regardless affect trust in the cryptocurrency market.
Without a mechanism for buying volatility, the risks of providing liquidity in new projects will not be properly compensated. Hence, eventually the market will not be able to source enough liquidity for new projects out of fear project might be another rug pull or poorly designed project like Luna.
Proper volatility prices theoretically would not lead to losses from liquidity provision.
This is an extreme case but UST/ETH, according to data from the Graph had only two liquidity providers for most of its existence whereas LUNA/ETH had several dozens.
Presumably, this would mean UST/ETH was getting its liquidity staked only from LUNA, hence properly optimized for the risk in UST/ETH, unlike LUNA/ETH which got its liquidity from mostly retail participants that were not properly valuing the risk.
A liquidity provider that had been providing liquidity to UST/ETH with borrowed UST and ETH tokens, would’ve made a 250%+ return in a few days. Whereas, the same strategy would’ve lead to an almost complete loss in the LUNA/ETH pair.
Conclusion
In this article I showed that volatility prices tend to be underpriced in Uniswap and very likely in all other AMMs with a similar design.
The underpicing of IV exposes liquidity providers to undue risks which cripple their returns and may decrease incentives to provide liquidity. This has suboptimal knock on effects leading to lower liquidity levels in DeFi and lack of support for new projects in the crypto industry.
In the next article, I will offer a solution to this problem through the introduction of a new protocol for not only buying volatility but also trading tokens commission free.
All data and scripts used to create the charts above can be found in https://github.com/gammaswap/mediumArticle6